MuscleHub A/B Test
- Alex Ricciardi

- Aug 19, 2020
- 7 min read
Updated: Aug 19, 2020
A Python Data Analysis Capstone Project From:
Codecademy Data Science course Python, Statistics with NumPy and Hypothesis Testing with SciPy section.
Project:
Analysis an A/B test from MuscleHub dataset.
▪ Introduction:
Help MuscleHub analyze an A/B test and choose a business strategy.
Currently, when a visitor to MuscleHub is considering buying a membership, he or she follows the following steps:
Take a fitness test with a personal trainer
Fill out an application for the gym
Send in their payment for their first month’s membership
Janet, the manager of MuscleHub, thinks that the fitness test intimidates some prospective members, so she has set up an A/B test.
Visitors will randomly be assigned to one of two groups:
Group A will still be asked to take a fitness test with a personal trainer
Group B will skip the fitness test and proceed directly to the application
▪ MuscleHub data:
Explore and manipulate the data for analyses.
MuscleHub SQLite database:
Janet of MuscleHub has a SQLite database, which contains several tables:
Display the first 5 rows.
visits contains information about potential gym customers who have visited MuscleHub

fitness_tests contains information about potential customers in "Group A", who were given a fitness test

applications contains information about any potential customers (both "Group A" and "Group B") who filled out an application. Not everyone in visits will have filled out an application.

purchases contains information about customers who purchased a membership to MuscleHub.

MuscleHub DataFrame:
To help with the MuscleHub data analysis, I combined the SQLite database tables into one
Python Pandas DataFrame:
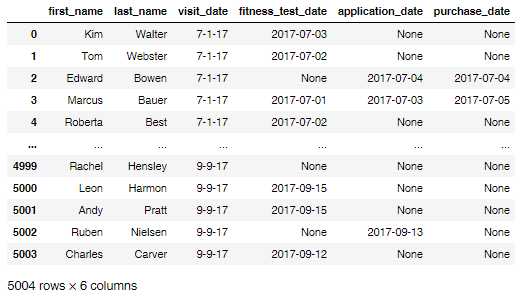
Note: The DataFrame lists the date, if the visitor took a fitness test.
MuscleHub DataFrame A/B test:
To help to investigate the A and B visitor groups, I added the column 'ab_test_group' to the DataFrame:
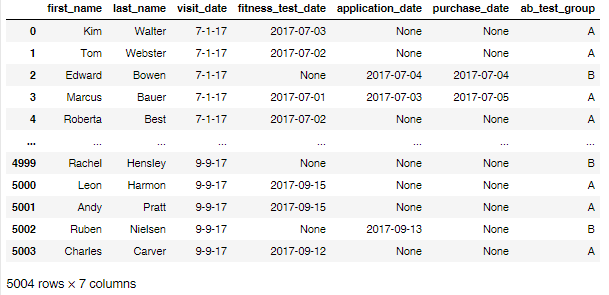
Now, we can see more clearly, which visitor belong to which group.
▪ MuscleHub A/B test inquiry:
Janet thinks that the fitness test intimidates some prospective members, a statistical analysis of the A/B test results will help Janet to affirm or negate her assumption.
We can perform the statistical analysis using the data from MuscleHub DataFrame.
Check Janet's A/B test viability:
For the A/B test to be statically viable, the visitors need to be split about half in group A and half in group B.
A/B test query:

A/B test percentages:

Janet's A/B test is statically viable.
MuscleHub's A/B test funnel:
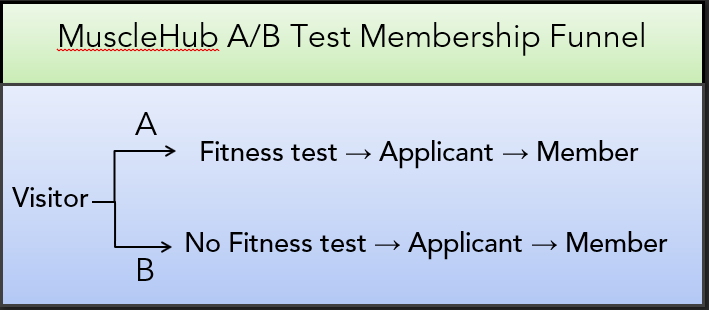
To affirm or negate Janet's assumption, we can perform the statistical analyses based on the MuscleHub's A/B test membership funnel.
▪ MuscleHub A/B test statistics:
We can use the data from MuscleHub DataFrame to perform the statistical analyses based on MuscleHub's A/B test membership funnel.
Phase-1: Visitor to Applicant
Explore and analyse the visitor to applicant phase based on the number of visitors that took the fitness test and applied for membership and the number of visitors that did not take the fitness test and applied for membership.
Visitor to Applicant query

Note: 75 more visitors from group B filled out a membership application than from group A.
Calculating the percentage of applications, the applications to visitors ratio, for each group, will give us a better understanding of the difference between the two groups related to
phase-1.
Applications to visitors ratio query:

Graph visitors to applicants percentages

Note:
The percentage of visitors for group A that applied for a membership is roughly equal to 10%.
The percentage of visitors for group B that applied for a membership is roughly equal to 13%.
The percentage of visitors who did not take the fitness test and applied for membership is 3% greater than the percentage of visitors who did take the fitness test and applied for membership.
It is probable, that by doing the fitness test, some of the visitors from test A were intimidated and choose not to apply for membership. A hypothesis test will affirm or negate the assumption that visitors that take the fitness test are less likely to fill out an application.
Hypotheses test:
Are visitors that take the fitness test less likely to apply for membership?
Having two categorical datasets (A/B) with two discrete categories
(Application, No application) needing to be compared.
I choose to perform a Chi Square Test.
The Chi Square Test from the Stats module of the Scipy Python library outputted a p-value of 0.00096, for the visitor to applicant MuscleHub A/B test.
Hypothesis test results analyses:
Under the MuscleHub A/B test, when applied to the number of visitors that filled a membership application, the p-value is under 0.05.
In other words, under the MuscleHub A/B test, from the visitor stage to the applicant stage, the difference between the tests A and B results are statistically significant.
Visitors that take the fitness test are statistically less likely to fill out an application.
Phase-2: Applicant to Member
Explore and analyse the applicant to member phase based on the number of applicants that took the fitness test and purchased a membership and the number of applicants that did not do the fitness test and purchased a membership.
Applicant to Member query

Note: 50 more applicants from group B purchased a membership than from group A.
Calculating the percentage of purchased membership, the purchases to applicants ratio, for each group, will give us a better understanding of the difference between the two groups related to phase-2.
Purchases to Applicants ratio query:

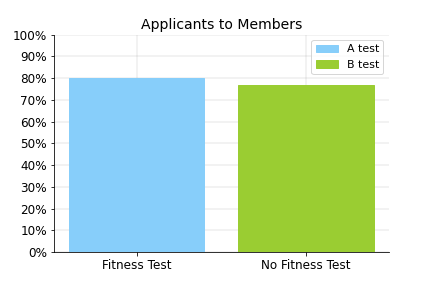
Graph applicants to members percentages:
Note:
The percentage of applicants for group A that purchased a membership is roughly equal to 80%.
The percentage of applicants for group B that purchased a membership is roughly equal to 77%.
The percentage of applicants who did the fitness test and purchased a membership is 3% greater than the percentage of visitors who did not do the fitness test and purchased a membership.
A difference of 3% is not significant enough to definitely conclude that an applicant who took the fitness test is more likely to purchase a membership.
A hypothesis test will affirm or negate the assumption that applicants who took the fitness test are more likely to fill out an application related to phase-2.
Hypotheses test:
Are applicants that took the fitness test more likely to purchase a membership?
Having two categorical datasets (A/B) with two discrete categories
(Member, Not Member) needing to be compared.
I choose to perform a Chi Square Test.
The Chi Square Test from the Stats module of the Scipy Python library outputted a p-value of 0.432, for the applicant to member MuscleHub A/B test.
Hypothesis test results analyses:
Under the MuscleHub AB test, when applied to the number of applicants who purchased a membership, the p-value is over 0.05.
In other words, under the MuscleHub A/B test, from the applicant stage to the member stage, the difference between the tests A and B results are not statistically significant.
Applicants that took the fitness test are not more likely to purchase a membership than the ones who did not take the fitness test.
In other words, the fitness test has statistically no influence on applicants purchasing memberships.
Visitor to Member:
Explore and analyse the visitor stage to the member stage based on the number of visitors that took the fitness test and purchased a membership and the number of visitors that did not take the fitness test and purchased a membership.
Visitor to Member query

Note: 50 more visitors from group B purchased a membership than from group A.
Calculating the percentage of purchased membership, the purchases to visitors ratio, for each group, will give us a better understanding of the difference between the two groups related to the visitor stage to the member stage path.
Purchases to Visitors ratio query:

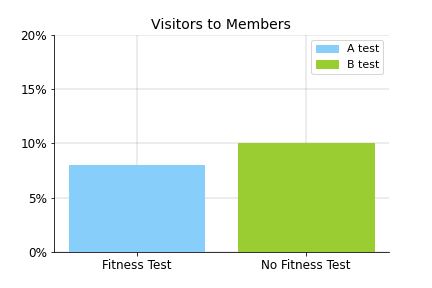
Graph visitors to members percentages:
Note:
The percentage of visitors for group A that purchased a membership is roughly equal to 8%.
The percentage of visitors for group B that purchased a membership is equal to 10%.
The percentage of applicants that took the fitness test and purchased a membership is 2% lesser than the percentage of visitors who did not do the fitness test and purchased a membership.
A difference of 2% is not significant enough to definitely conclude that by doing the fitness test visitors are less likely to purchase a membership.
A hypothesis test will affirm or negate the assumption that an visitor that take the fitness test is less likely to purchase a membership.
Hypotheses test:
Are visitors that take the fitness test less likely to purchase a membership?
Having two categorical datasets (A/B) with two discrete categories
(Member, Not Member) needing to be compared.
I choose to perform a Chi Square Test.
The Chi Square Test from the Stats module of the Scipy Python library outputted a p-value of 0.0147, for the visitor to member MuscleHub A/B test.
Hypothesis test results analyses:
Under the MuscleHub A/B test, when applied to the number of visitors who purchased a membership, the p-value is under 0.05.
In other words, under the MuscleHub A/B test, from the visitor stage to the member stage, the difference between the tests A and B results are statistically significant.
Visitors that take the fitness test are statistically less likely to purchase a membership than the ones who do not take the fitness test.
▪ Statistical Results Analyses:
The MuscleHub A/B test statistical results:
Visitors that take the fitness test are statistically less likely to fill out an application.
Applicants that took the fitness test are not more likely to purchase a membership than the ones who did not take the fitness test. In other words, the fitness test has statistically no influence on applicants purchasing memberships.
Visitors that take the fitness test are statistically less likely to purchase a membership than the ones who do not take the fitness test.
The MuscleHub A/B test statistical results show that visitors who take the fitness test are significantly less likely to apply for and purchase a membership.
Janet's assumption that the fitness test intimidates some prospective members, is affirm by the MuscleHub A/B test statistical results and collaborated by some of the costumer interviews provided by MuscleHub.
Interviewees comments:
"I took the MuscleHub fitness test because my coworker Laura recommended it. Regretted it.” - Sonny "Dad Bod", 26, Brooklyn"
"When I walked into MuscleHub I wasn’t accosted by any personal trainers trying to sell me some mumbo jumbo, which I really appreciated. Down at LiftCity they had me doing burpees 30 seconds after I walked in the door and I was like “woah guys slow your roll, this is TOOOO much for Jesse!” I still ended up not signing up for a membership because the weight machines had all those sweat stains on them and you know, no thanks." - Jesse, 35, Gowanes
Recommendations:
Based on the MuscleHub A/B test statistical results and some of the interview, we recommend removing the fitness test from the sign-up process.
We also recommend to keep the sign-up process simple and friendly as possible.
Interviewee comments:
"I saw an ad for MuscleHub on facebook and thought I'd check it out! The people there were suuuuuper friendly and the whole sign-up process took a matter of minutes. I tried to sign up for LiftCity last year, but the fitness test was way too intense. This is my first gym membership EVER, and MuscleHub made me feel welcome."
- Shirley, 22, Williamsburg
Some interviewees felt that the fitness test provided a useful baseline to compare themselves to. So we recommend making the fitness test optional to members after their first month’s membership payment is received.
Interviewee comments:
"I always wanted to work out like all of the shredded people on the fitness accounts I see on Instagram, but I never really knew how to start. MuscleHub’s introductory fitness test was super helpful for me! After taking the fitness test, I had to sign up and keep coming back so that I could impress my trainer Rachel with how much I was improving!"
- Cora, 23, Hoboken


Comments