Predict Titanic Survival
- Alex Ricciardi

- Dec 30, 2020
- 3 min read
My Codecademy practice project from the Data Scientist Path Foundations of Machine Learning: Supervised Learning Course, Logistic Regression.
▪ Overview
The RMS Titanic set sail on its maiden voyage in 1912, crossing the Atlantic from Southampton, England to New York City. The ship never completed the voyage, sinking to the bottom of the Atlantic Ocean after hitting an iceberg, bringing down 1,502 of 2,224 passengers onboard.
In this project I will create a Logistic Regression model that predicts which passengers survived the sinking of the Titanic based on age, sex and purchased ticket class.
The data I will be using for training our model is provided by Kaggle.
▪ Project Goal
Predict which passengers survived the sinking of the Titanic using machine learning logistic regression models.
▪ Project Requirements
Python3
Machine Learning
The Python Libraries:
Pandas
Sklearn
Numpy
▪ Links:
Project Python Code (Jupyter Notebook)
Preprocessing the Data
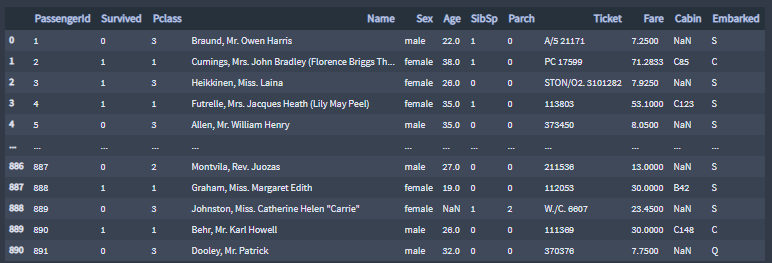
The file passengers.csv contains the data of 892 passengers onboard the Titanic when it sank that fateful day.
▪ The Data

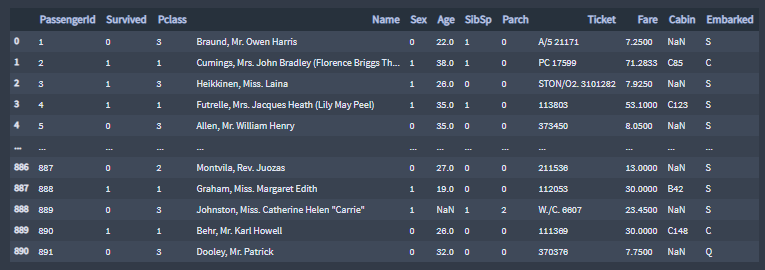
▪ Clean The Data
Given the saying, “women and children first,” Sex and Age seem like good features to predict survival. All values female are replaced with 1 and all values male are replaced with 0.

Replacing multiple missing values, or nans, in the Age column with the titanic passengers mean age.
passengers['Age']

# Passenger 888
0      22.0
1      38.0
2      26.0
3      35.0
4      35.0
       ...
886    27.0
887    19.0
888     NaN
889    26.0
890    32.0
Name: Age, Length: 891, dtype: float64

passengers.Age.fillna(value=passengers.Age.mean(),inplace=True)
passengers['Age']

# Passenger 888 updated
0      22.000000
1      38.000000
2      26.000000
3      35.000000
4      35.000000
         ...
886    27.000000
887    19.000000
888    29.699118
889    26.000000
890    32.000000
Name: Age, Length: 891, dtype: float64
▪ Utilize The Feature Pclass
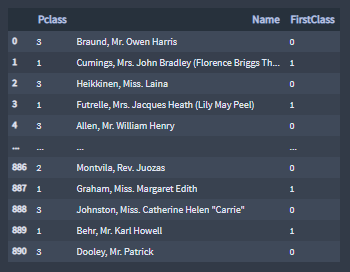
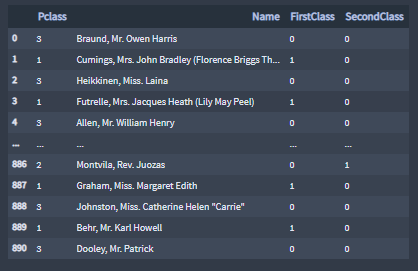
Given the strict class system onboard the Titanic, dividing the Pclass feature into
the sub-features FirstClass and SecondClass will help modeling the prediction of who is more likely survive the sinking of the Titanic.
The feature FirstClass attributes the value 1 to passengers in first class and the values 0 for all other passengers.

The feature SecondClass attributes the value 1 to passengers in second class and the values 0 for all other passengers.

Logistic regression
Logistic regression is a statistical model that in its basic form uses a logistic function to model a binary dependent variable.
▪ Select and Split the Data
Now that the data is clean, to build my model, I selected the columns Sex, Age, FirstClass, and SecondClass (independent variables) and store them in a variable named features. I selected the column Survived (binary dependent variable) and store it a variable named survival.
features = passengers[['Sex', 'Age', 'FirstClass', 'SecondClass']]
survival = passengers.Survived

# Perform train, test, split
features_train, features_test, labels_train,  labels_test = train_test_split(features,survival,test_size=0.25, random_state=42)
▪ Normalize the Data
Since I am using Logistic Regression models, I need to implement the Regularization method on the features, I need to scale the feature data, for that purpose, I created a StandardScaler object, .fit_transform() it on the training features, and .transform() the test features.
# Scale the feature data so it has mean = 0 and standard deviation = 1
scaler = StandardScaler()
norm_train_features = scaler.fit_transform(features_train)
norm_test_features = scaler.fit_transform(features_test)
▪ Create and Evaluate the Model
Model
# Create and train the model
model = LogisticRegression()
model.fit(norm_train_features , labels_train)
Train Datasets Coefficient of Determination
# Score the model on the train dataset
model.score(norm_train_features , labels_train)

0.7949101796407185
Test Datasets Coefficient of Determination
# Score the model on the test dataset
model.score(norm_test_features , labels_test)

0.7982062780269058
Features Coefficient of Determination
list(zip(['Sex','Age','FirstClass','SecondClass'],model.coef_[0]))

[('Sex', 1.2127928945459108),
('Age', -0.366264984201663),
('FirstClass', 0.8732654291428307),
('SecondClass', 0.5229584041786293)]
Predict with the Model
Let’s use the model to make predictions on the survival of a few fateful passengers. Provided in the code editor is information for 3rd class passenger Jack and 1st class passenger Rose, from the movie Titanic, stored in NumPy arrays. The arrays store 4 feature values, in the following order:
Sex, represented by a 0 for male and 1 for female
Age, represented as an integer in years
FirstClass, with a 1 indicating the passenger is in first class
SecondClass, with a 1 indicating the passenger is in second class
The third array, John_Doe, is a random passenger array
# Sample passenger features
# Male, 20 years old, No-first class, No-Second class
Jack = np.array([0.0,20.0,0.0,0.0])
# Female, 17 years old, Yes-first class, No-Second class
Rose = np.array([1.0,17.0,1.0,0.0])
# Female, 49 years old, no-first class, No-Second class
John_Doe = np.array([1.0,49.0,0.0,0.0])
▪ Model's Predictions
# Combine passenger arrays
sample_passengers = np.array([Jack , Rose, John_Doe])
# Scale the sample passenger features
sample_passengers = scaler.transform(sample_passengers)
# Make survival predictions
print(model.predict(sample_passengers))

# Output
[0 1 0]
Jack and John_Doe are predicted to Not survive
▪ Model's Probability of Survival Values
prob = model.predict_proba(sample_passengers)

prob_df = pd.DataFrame({
    'Passenger':['Rose', 'Jack', 'John_Doe'],
    '% Likely To Survive':[ val[0]*100 for val in prob],
    '% Likely To Not-Survive':[ val[1]*100 for val in prob]})
prob_df
Jack, a 20 years old male in 3rd class, is 91.50% likely to Not-survive the sinking of the Titanic.
John_Doe, a 49 years old female in 3rd class, is 38.74% likely to Not-survive the sinking of the Titanic.
Rose, a 17 years old female in 1st class, is 10.57% likely to Not-survive the sinking of the Titanic.


Comments