Yelp Rating Regression Predictor
- Alex Ricciardi

- Dec 19, 2020
- 6 min read
Updated: Dec 20, 2020
My Codecademy practice project (revision) from the Data Scientist Machine Learning Fundamentals Section.
▪ Overview
The restaurant industry is tougher than ever, with restaurant reviews blazing across the Internet from day one of a restaurant's opening. But as a lover of food, you and your friend decide to break into the industry and open up your own restaurant, Danielle's Delicious Delicacies. Since a restaurant's success is highly correlated with its reputation, you want to make sure Danielle's Delicious Delicacies has the best reviews on the most queried restaurant review site: Yelp! While you know your food will be delicious, you think there are other factors that play into a Yelp rating and will ultimately determine your business's success.
With a dataset of different restaurant features and their Yelp ratings, you decide to use a Multiple Linear Regression model to investigate what factors most affect a restaurant's Yelp rating and predict the Yelp rating for your restaurant!
In this project we'll be working with a dataset provided by Yelp.
Yelp has been one of the most popular Internet rating and review sites for local businesses since its initial inception in 2004. Yelp founders saw that word-of-mouth was a powerful purveyor of new customers, but with the classic local community structure breaking apart in an online era, how could individuals know which businesses to trust? Yelp was the answer – an online review site in which customers shared their experiences, helping others make informed decisions about restaurants, auto-repair shops, and more.
▪ Project Goal:
Predict the restaurant Yelp rating using supervise machine learning models.
▪ Project Requirements
Be familiar with:
Python3
Supervise Machine Learning
The Python Libraries:
Pandas
Sklearn
Matplotlib
Os
▪ Links:
Project Python Code Presentation (Jupyter Notebook)
The Data

▪ Load the data
For a more detailed explanation of the features in each .json file, see the accompanying explanatory feature document.
To get a better understanding of the dataset we can use Pandas to explore the data in DataFrame form.
Load the data from each of the json files with the following naming conventions:
yelp_business.json into a DataFrame named businesses
yelp_review.json into a DataFrame named reviews
yelp_user.json into a DataFrame named users
yelp_checkin.json into a DataFrame named checkins
yelp_tip.json into a DataFrame named tips
yelp_photo.json into a DataFrame named photos
Code sample:
businesses = pd.read_json('yelp_data/yelp_business.json',lines=True)▪ Inspecting the data
How many different businesses are in the dataset? What are the different features in the review DataFrame?
print(f'The total of businesses is: {len(businesses)}')
print('\nThe the review features are:')
for feature in reviews.columns:
    print(f'        - {feature}')

The total of businesses is: 188593

The the review features are:
        - business_id
        - average_review_age
        - average_review_length
        - average_review_sentiment
        - number_funny_votes
        - number_cool_votes
        - number_useful_votes
What is the range of values for the features in the users DataFrame?
users.describe()
What is the Yelp rating, or stars, of the establishment with
business_id = 5EvUIR4IzCWUOm0PsUZXjA.
f"The number of starts is equal to: {int(businesses[businesses['business_id'] ==
'5EvUIR4IzCWUOm0PsUZXjA']['stars'].values)}"

The number of starts is equal to: 3
▪ Merge the Data
Since we are working with data from several files, we need to combine the data into a single DataFrame that allows us to analyze the different features with respect to our target variable, the Yelp rating. We can do this by merging the multiple DataFrames we have together, joining them on the columns they have in common. In our case, this unique identifying column is the business_id.
df = pd.merge(businesses, reviews, how='left', on='business_id')
df = pd.merge(df, users, how='left', on='business_id')
df = pd.merge(df, checkins, how='left', on='business_id')
df = pd.merge(df, tips, how='left', on='business_id')
df = pd.merge(df, photos, how='left', on='business_id')

df.columns

Index(['address', 'alcohol?', 'attributes', 'business_id', 'categories',
       'city', 'good_for_kids', 'has_bike_parking', 'has_wifi',
       'hours',
       'is_open', 'latitude', 'longitude', 'name', 'neighborhood',
       'postal_code', 'price_range', 'review_count', 'stars', 'state',
       'take_reservations', 'takes_credit_cards', 'average_review_age',
       'average_review_length', 'average_review_sentiment',
       'number_funny_votes', 'number_cool_votes',
       'number_useful_votes',
       'average_number_friends', 'average_days_on_yelp',
       'average_number_fans',
       'average_review_count', 'average_number_years_elite', 'time',
       'weekday_checkins', 'weekend_checkins', 'average_tip_length',
       'number_tips', 'average_caption_length', 'number_pics'],
      dtype='object')
▪ Clean the Data
We are getting really close to the fun analysis part! We just have to clean our data a bit so we can focus on the features that might have predictive power for determining an establishment's Yelp rating.
In a Linear Regression model, our features will ideally be continuous variables that have an affect on our dependent variable, the Yelp rating. For this project with will also be working with some features that are binary, on the scale [0,1]. With this information, we can remove any columns in the dataset that are not continuous or binary, and that we do not want to make predictions on.
features_to_remove = ['address','attributes','business_id','categories','city','hours','is_open','latitude','longitude','name','neighborhood','postal_code','state','time']

df.drop(labels=features_to_remove, axis=1, inplace=True)
Now we just have to check our data to make sure we don't have any missing values, or `NaN`s, which will prevent the Linear Regression model from running correctly.
df.isna().any()

alcohol?                      False good_for_kids                 False has_bike_parking              False has_wifi                      False price_range                   False review_count                  False stars                         False take_reservations             False takes_credit_cards            False average_review_age            False average_review_length         False average_review_sentiment      False number_funny_votes            False number_cool_votes             False number_useful_votes           False average_number_friends        False average_days_on_yelp          False average_number_fans           False average_review_count          False average_number_years_elite    False weekday_checkins               True weekend_checkins               True average_tip_length             True number_tips                    True average_caption_length         True number_pics                    True dtype: bool
df.fillna({'weekday_checkins':0,
'weekend_checkins':0,
'average_tip_length':0,
'number_tips':0,
'average_caption_length':0,
'number_pics':0},
inplace=True)Exploratory Analysis
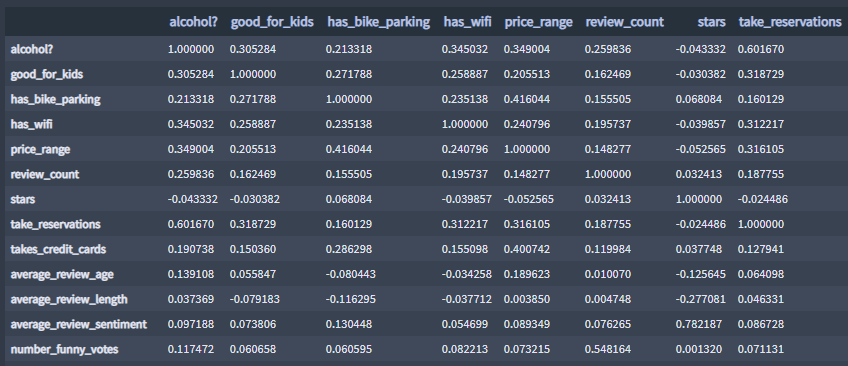
Now that our data is all together, let's investigate some of the different features to see what might correlate most with our dependent variable, the Yelp rating (called stars in our DataFrame). The features with the best correlations could prove to be the most helpful for our Linear Regression model!
# Pandas DataFrames have a really helpful method, .corr(),
# that allows us to see the correlation coefficients for each pair of
# our different features
df.corr()
Correlation DataFrane sample:
▪ Scattersplots:
To further visualize these relationships, we can plot certain features against our dependent variable, the Yelp rating. We can use Matplotlib's .scatter() method:
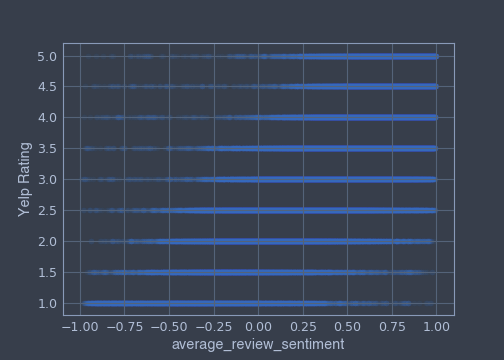
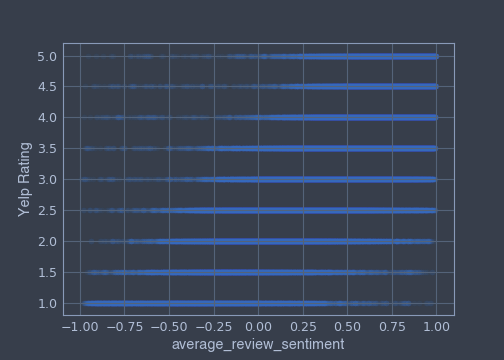
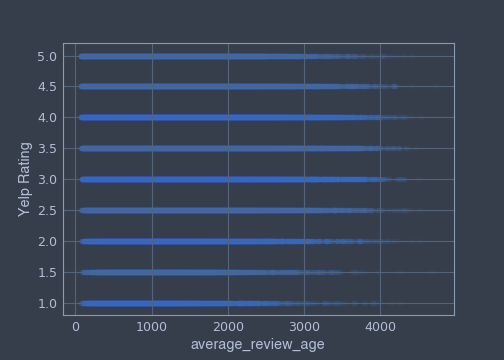
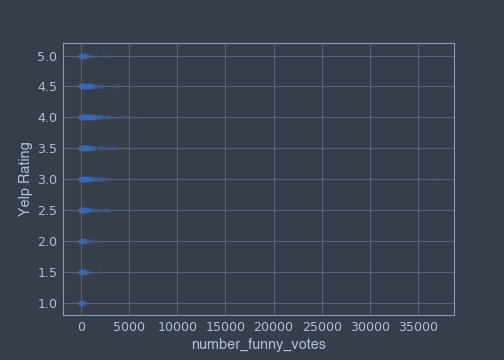
The average_review_sentiment correlates the best with Yelp rating.
A customer who gave a negative review sentiment to a business will rate the business by giving it a start or two, compare to a customer who gave a positive review sentiment to a business will rate the business by giving it four starts or five.
Regression Models
"The purpose of machine learning is often to create a model that explains some real-world data, so that we can predict what may happen next, with different inputs. The simplest model that we can fit to data is a line. When we are trying to find a line that fits a set of data best, we are performing Linear Regression. We often want to find lines to fit data, so that we can predict unknowns." Codecademy: Introduction to Linear Regression
In Supervised learning, you train the machine using data which is well "labeled".
"Supervised machine learning algorithms are amazing tools capable of making predictions and classifications. However, it is important to ask yourself how accurate those predictions are. After all, it’s possible that every prediction your classifier makes is actually wrong! Luckily, we can leverage the fact that supervised machine learning algorithms, by definition, have a dataset of pre-labeled datapoints. In order to test the effectiveness of your algorithm, we’ll split this data into: training set, validation set and test set." Codecademy: Training Set vs Validation Set vs Test Set
▪ Data Selection
In order to put our data into a Linear Regression model, we need to separate out our features to model on and the Yelp ratings. From our correlation analysis we saw that the three features with the strongest correlations to Yelp rating are average_review_sentiment, average_review_length, and average_review_age. Since we want to dig a little deeper than average_review_sentiment, which understandably has a very high correlation with Yelp rating, let's choose to create our first model with average_review_length and average_review_age as features.
▪ Coefficient of Determination
Note: The model scores are the models' coefficient of determination, R^2 , for our example, is the coefficient of determinations of the winnings test set relative to each feature test set.
"In statistics, the coefficient of determination, is the proportion of the variance in the dependent variable that is predictable from the independent variable(s). It is a statistic used in the context of statistical models whose main purpose is either the prediction of future outcomes or the testing of hypotheses, on the basis of other related information. It provides a measure of how well observed outcomes are replicated by the model, based on the proportion of total variation of outcomes explained by the model." Coefficient of Determination
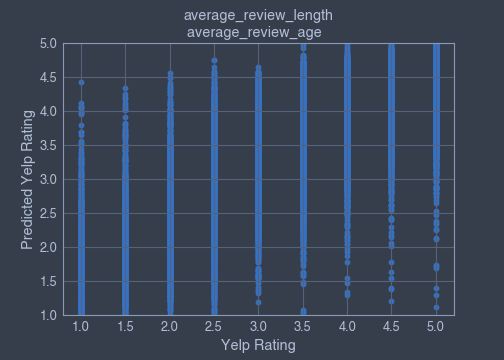
▪ average_review_length and average_review_age features
Coefficient of determination : 0.08250309566544889
Note:
When using the the python library Sklearn, the models have an attribute `.coef_` which is an array of the feature coefficients determined by fitting the models to the training data.
average_review_length coef_ = -0.0009977176852074563 average_review_age coef_ = -0.00011621626836366434
The average_review_length feature is better than average_review_age coef_ feature at predicting the Yeld rating.
Scatterplots:
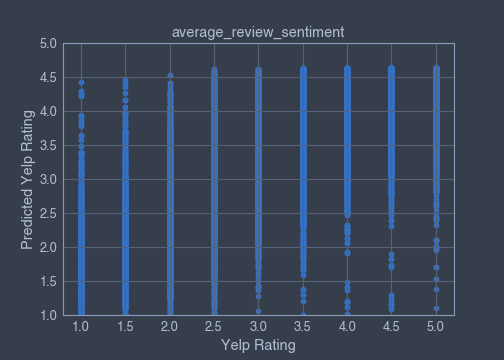
▪ average_review_sentiment feature
Coefficient of determination :
Train x and y datasets coefficient of determination = 0.6118980950438655
Train x and y datasets coefficient of determination = 0.6114021046919491
average_review_sentiment coef_ = 2.303390843374988
Scatterplots:
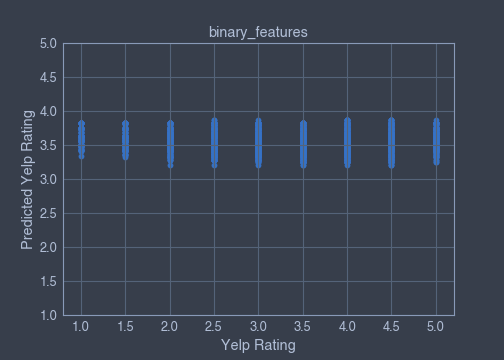
▪ Subset of binary-features
binary_features = ['alcohol?','has_bike_parking','takes_credit_cards','good_for_kids','take_reservations','has_wifi']Coefficient of determination :
Train x and y datasets coefficient of determination = 0.012223180709591386
Train x and y datasets coefficient of determination = 0.012223180709591386
Features coefficient of determination, coef_:
[('has_bike_parking', 0.19003008208047414),
('alcohol?', -0.1454967070813194),
('has_wifi', -0.13187397577759247),
('good_for_kids', -0.08632485990339629),
('takes_credit_cards', 0.07175536492195116),
('take_reservations', 0.04526558530451656)]
Scatterplots:
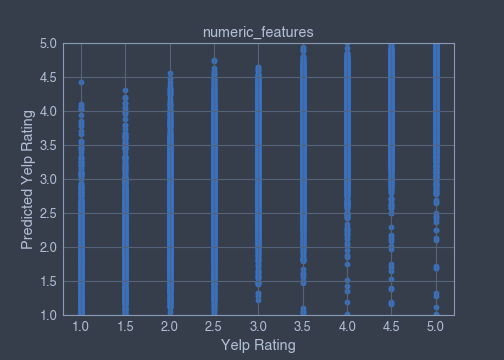
▪ Subset of numeric-features
numeric_features = ['review_count','price_range','average_caption_length','number_pics','average_review_age','average_review_length','average_review_sentiment','number_funny_votes','number_cool_votes','number_useful_votes','average_tip_length','number_tips','average_number_friends','average_days_on_yelp','average_number_fans','average_review_count','average_number_years_elite','weekday_checkins','weekend_checkins']Coefficient of determination :
Train x and y datasets coefficient of determination = 0.6734992593766659
Train x and y datasets coefficient of determination = 0.6713318798120143
Features coefficient of determination, coef_:
[('average_review_sentiment', 2.272107664209628),('price_range',-0.08046080962701695),('average_number_years_elite',-0.07190366288054188), ('average_caption_length',-0.0033470660077858055),('number_pics',-0.002956502812897175),('number_tips',-0.001595305078903779),('number_cool_votes',0.0011468839227085428),('average_number_fans',0.0010510602097440632), ('average_review_length',-0.0005813655692094664),('average_tip_length',-0.000532203206346085),('number_useful_votes',-0.00023203784758731028),('average_review_count',-0.00022431702895059404),('average_review_age',-0.0001693060816507462),('average_days_on_yelp',0.00012878025876703232),('weekday_checkins',5.918580754471492e-05),('weekend_checkins',-5.518176206983222e-05),('average_number_friends',4.82699211159939e-05),('review_count',-3.483483763727934e-05),('number_funny_votes',-7.88439567394987e-06)]Scatterplots:
▪ All the features
all_features = binary_features + numeric_featuresCoefficient of determination :
Train x and y datasets coefficient of determination = 0.6807828861895334
Train x and y datasets coefficient of determination = 6782129045869243
Scatterplots:
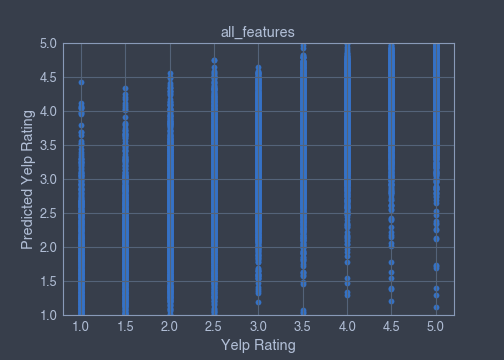
Our best model is the model using all features.
Danielle's Delicious Delicacies' Debut
What will Danielle's Delicious Delicacies Yelp rating be? Let's use our the all_features model to make a prediction.
▪ Perspective
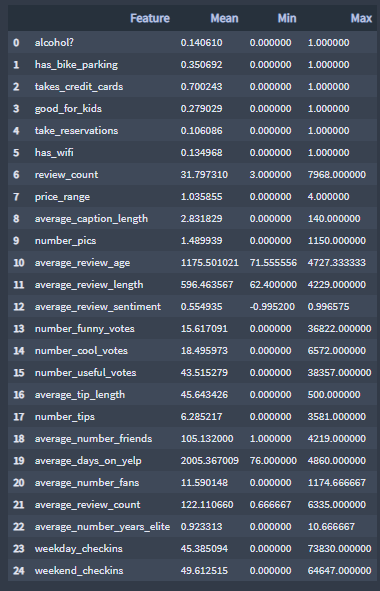
To give you some perspective on the restaurants already out there, calculate the mean, minimum, and maximum values for each feature of the all_features list.
df_perspective:
▪ Expectations
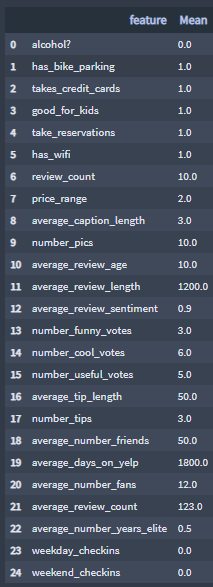
Based on your plans for the restaurant, how you expect your customers to post on your Yelp page, and the values above, assign to each feature a the expected Danielle's Delicious Delicacies mean value.
df_expectations:
▪ Yelp rating prediction
Based on my plans for the restaurant,
Danielle's Delicious Delicacies's Yelp rating should be:
model.predict(df_expectations['Mean'].values.reshape(1,-1)).tolist()[0]4.037990041446358Note: the average Yelp rating is:
model.predict(df_perspective['Mean'].values.reshape(1,-1)).tolist()[0]

3.629678154623998


Comments